Blog Posts

Data art: Haunted
Make point pattern spookier
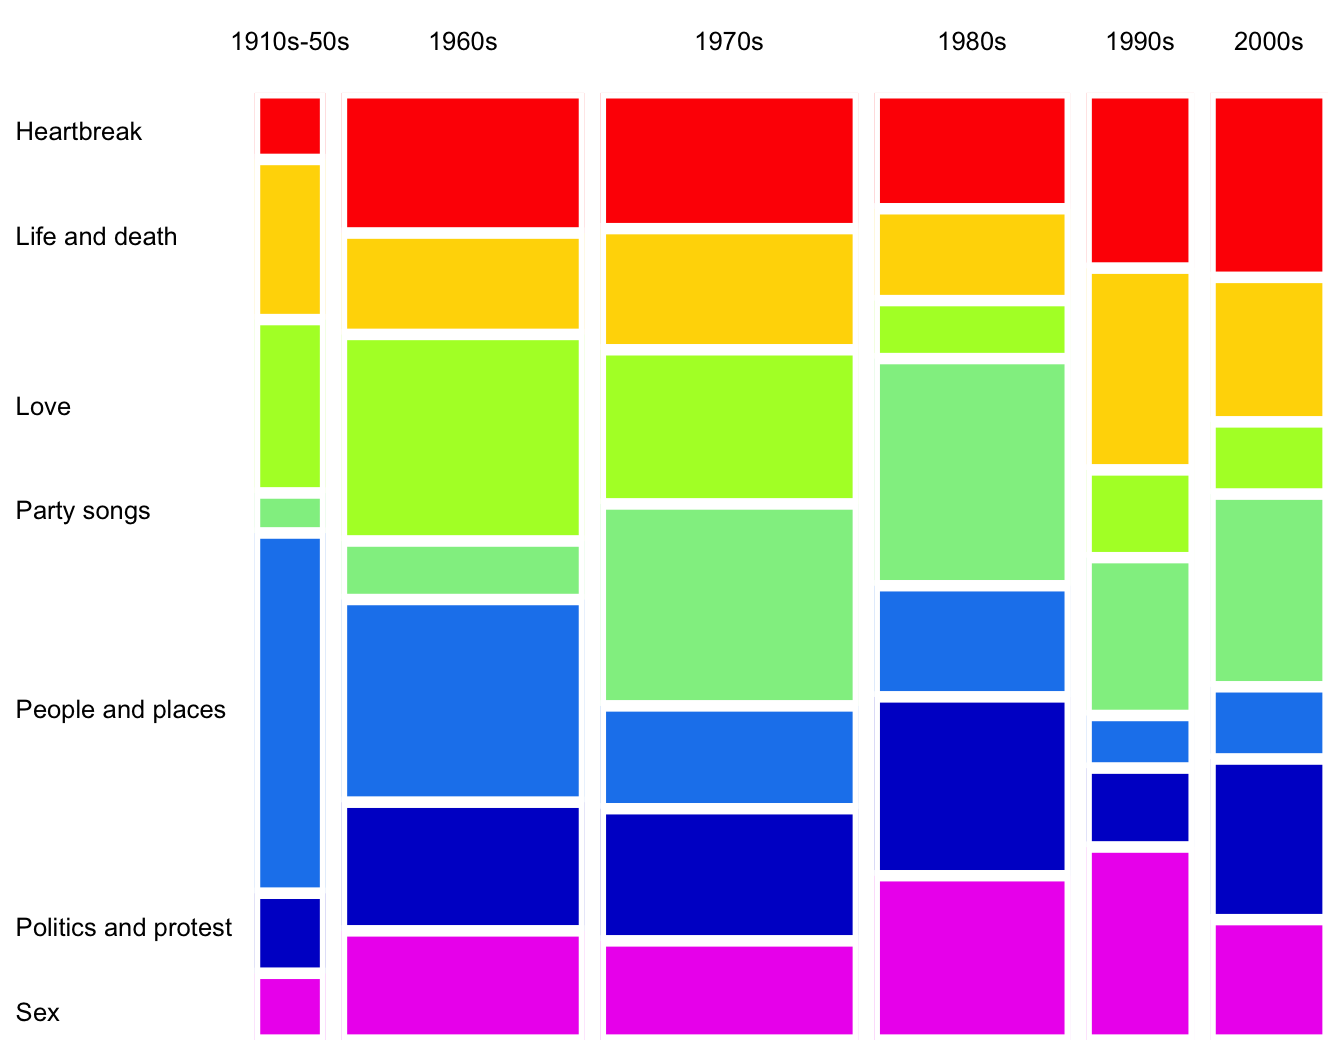
Mosaic plots from scratch with ggplot2
Marimekko ab initio
NFL CoD, Gaussian version
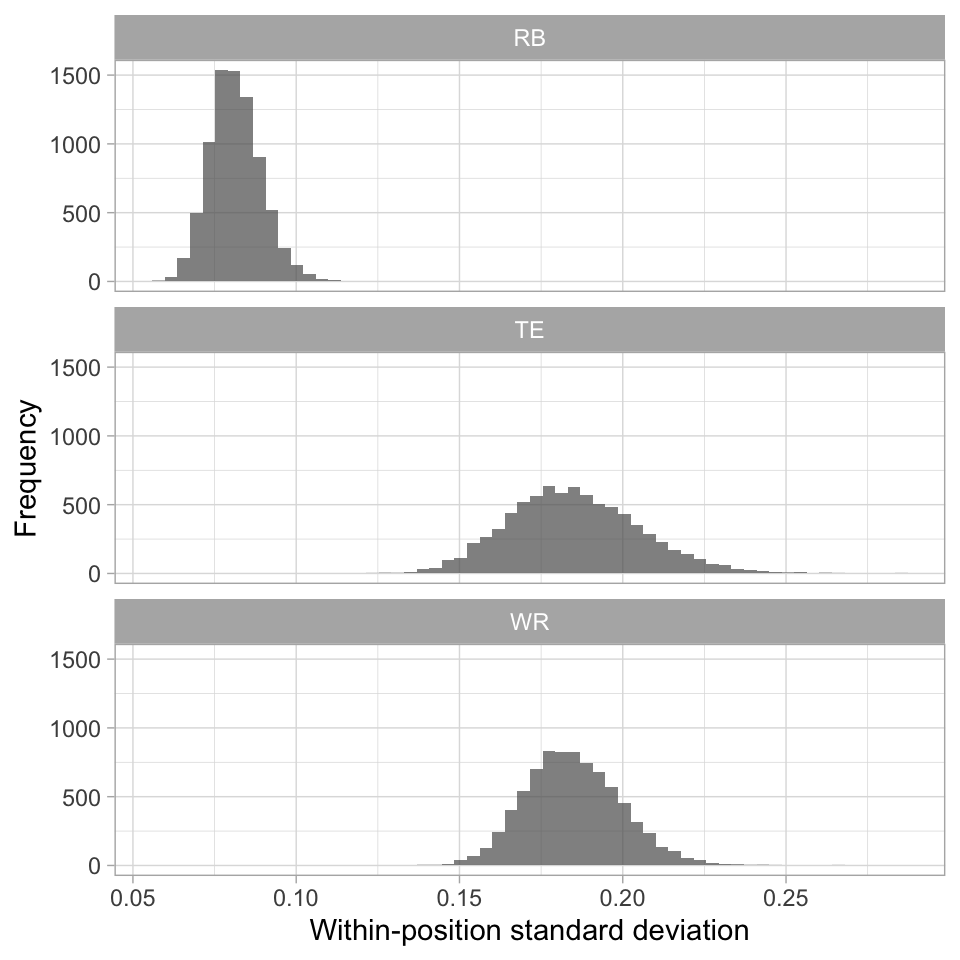
Modeling highly concentrated angular data
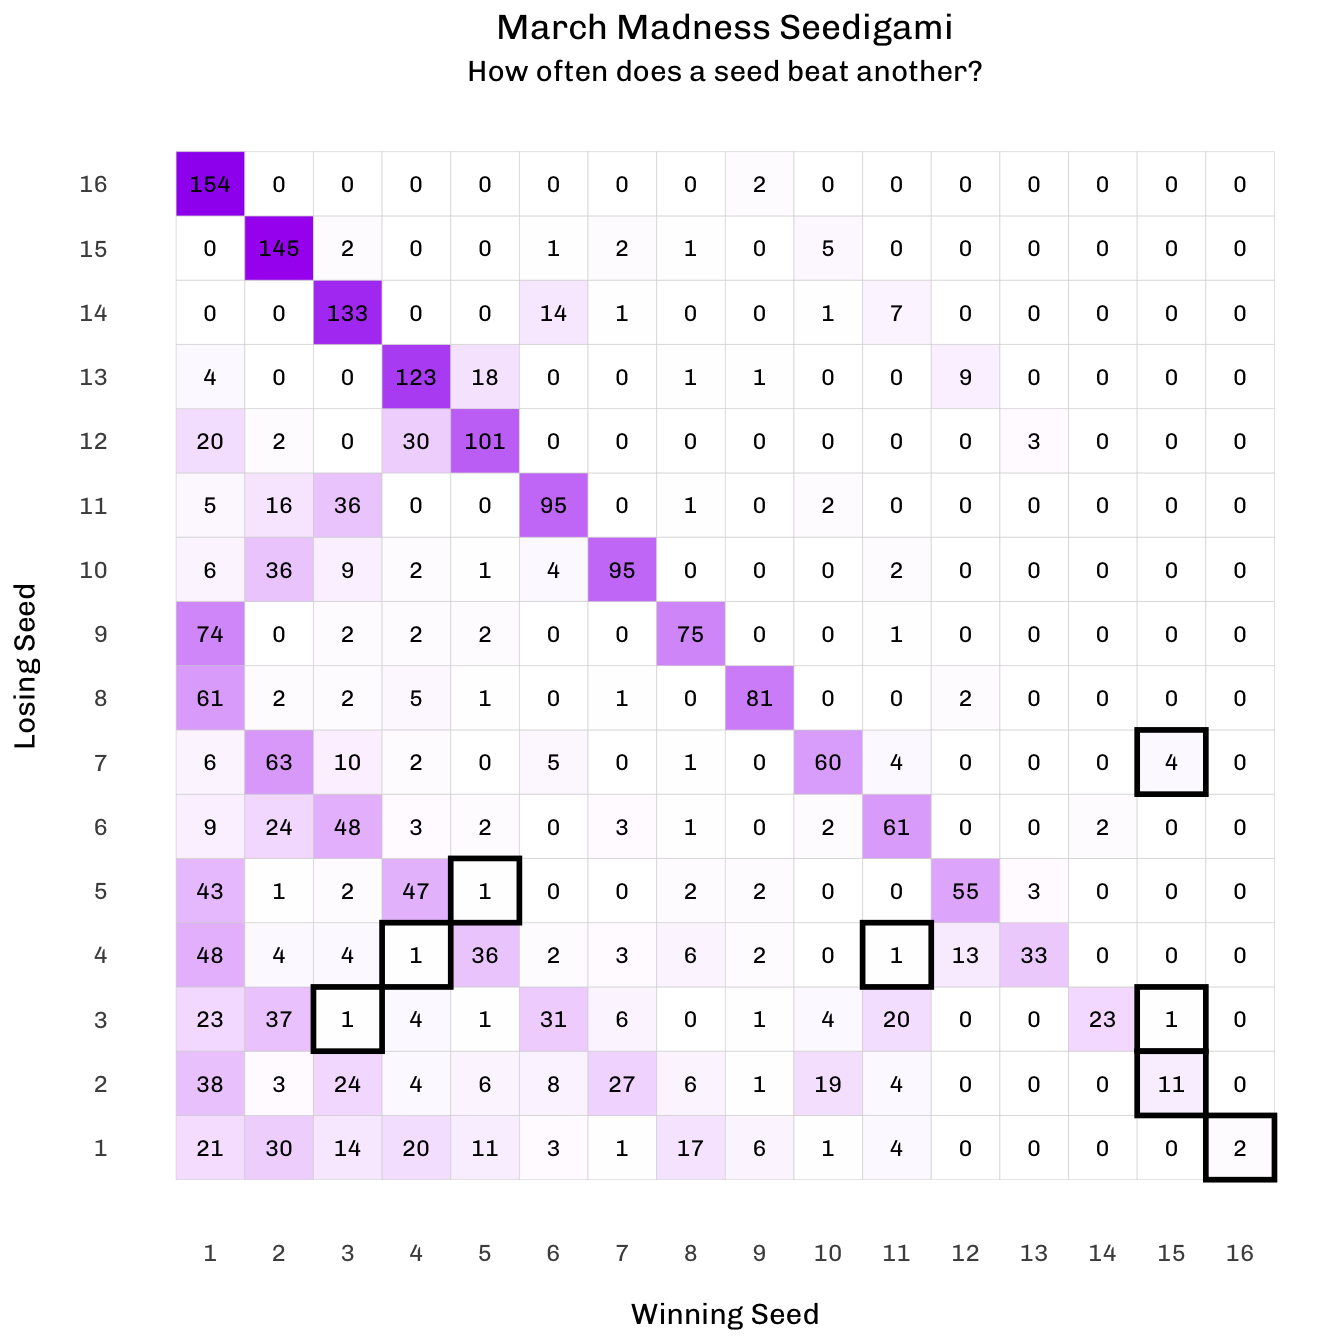
March Madness Seedigami
How does each seed perform?
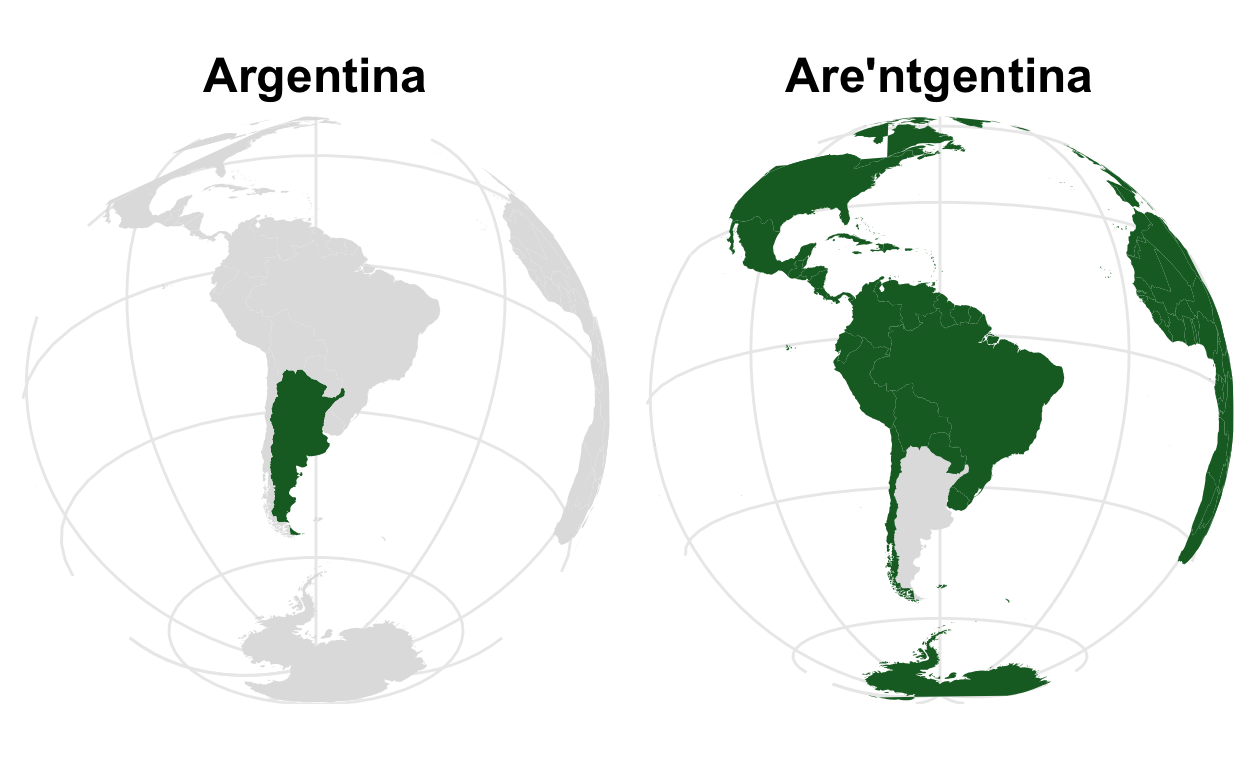
Recreating a Terrible Map
For fun only. Don't try this at home.
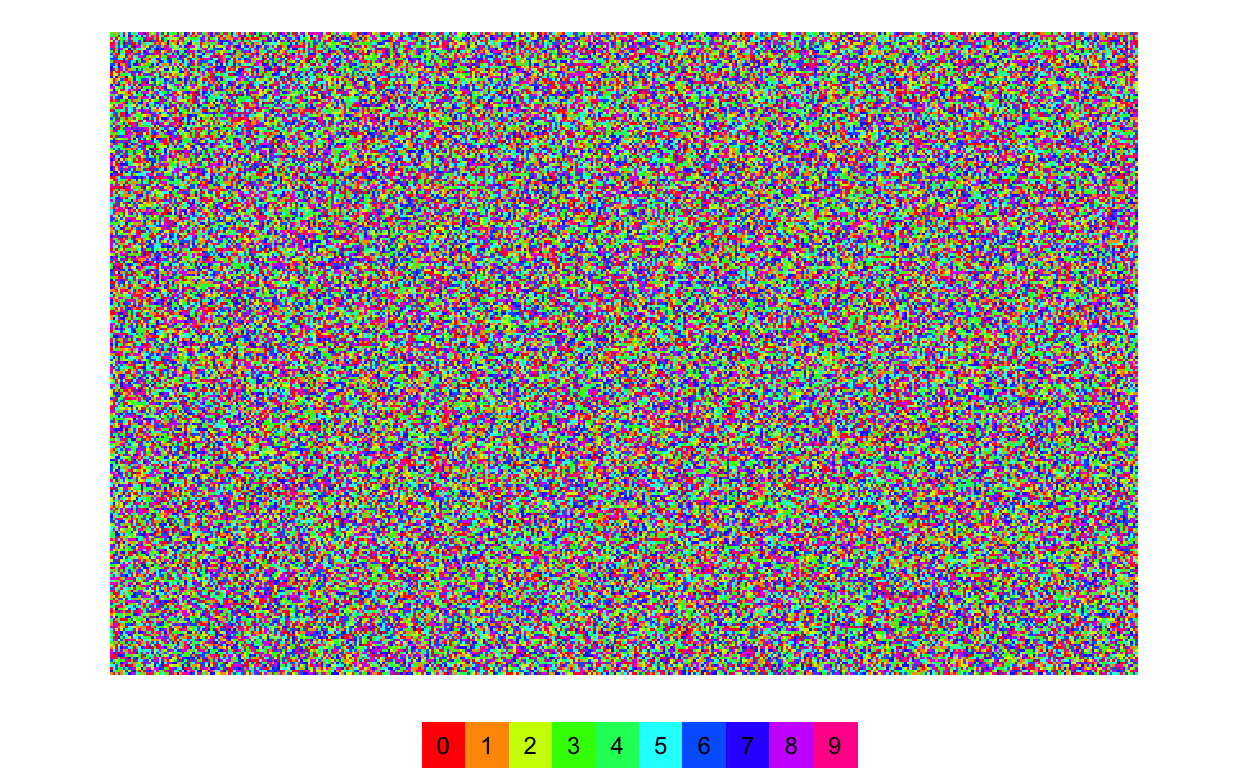
Heatmaps of the first 100000 digits of pi and e
Chaos of numbers
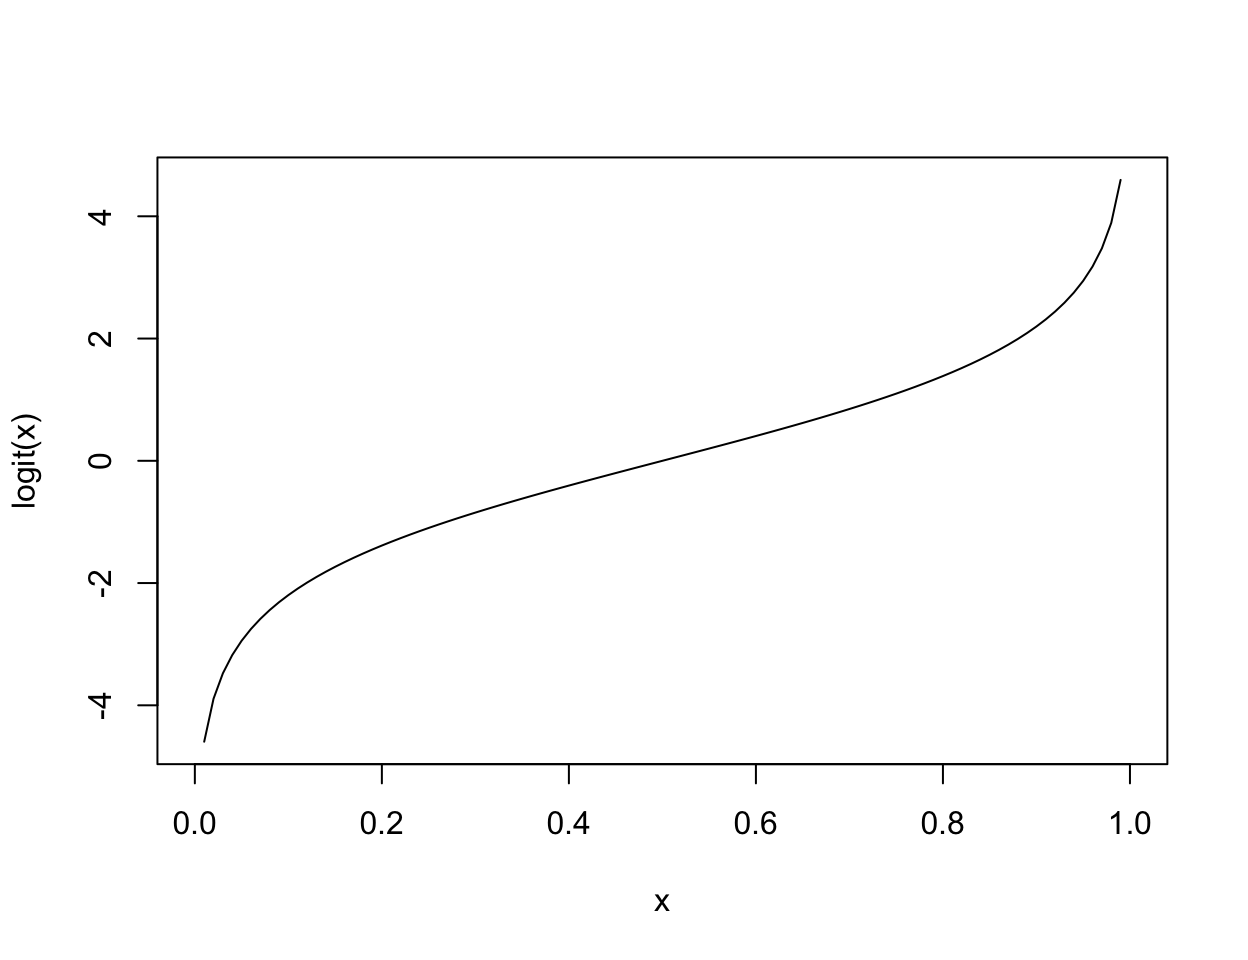
Base R's built-in logit and expit functions
`plogis()` and `qlogis()`
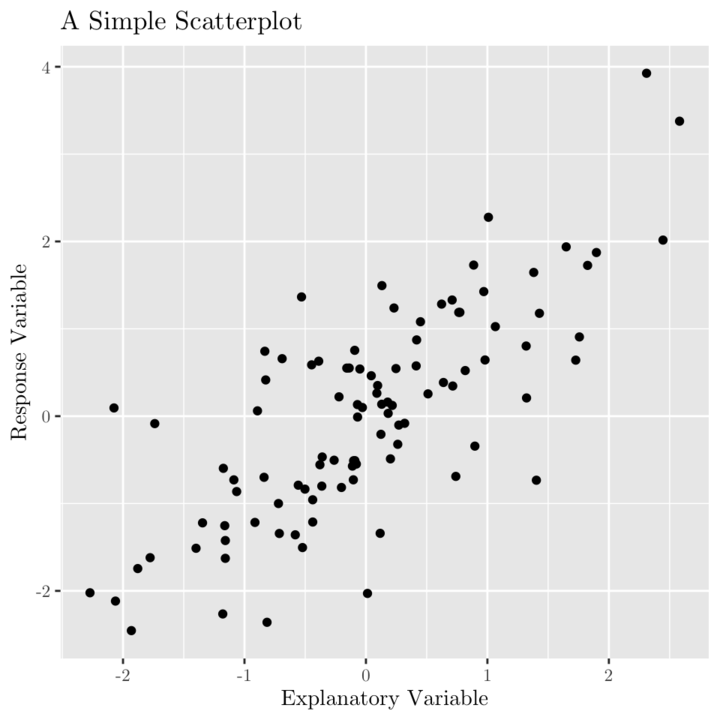
LaTeX Font for Data Viz in R
For future reference
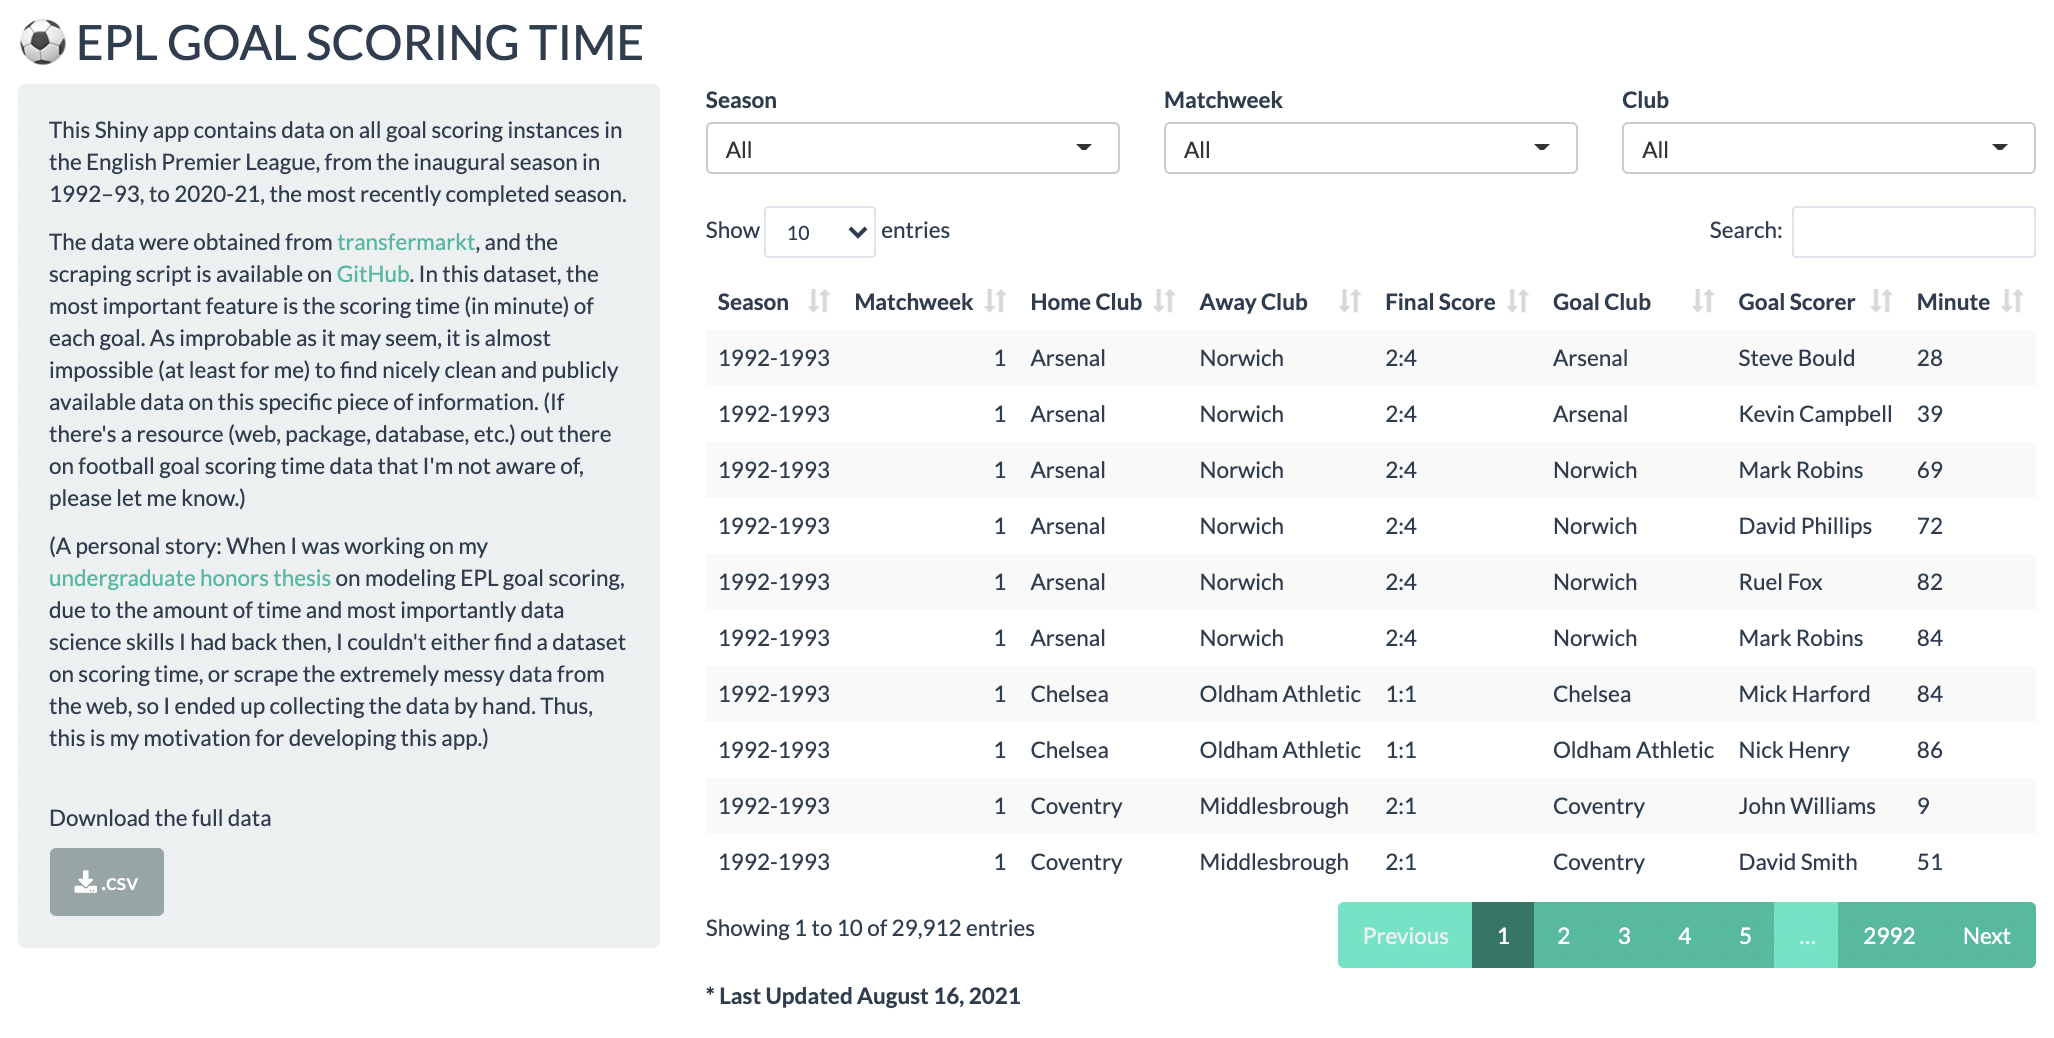
EPL Goal Scoring Time Data Shiny App
My first Shiny app.
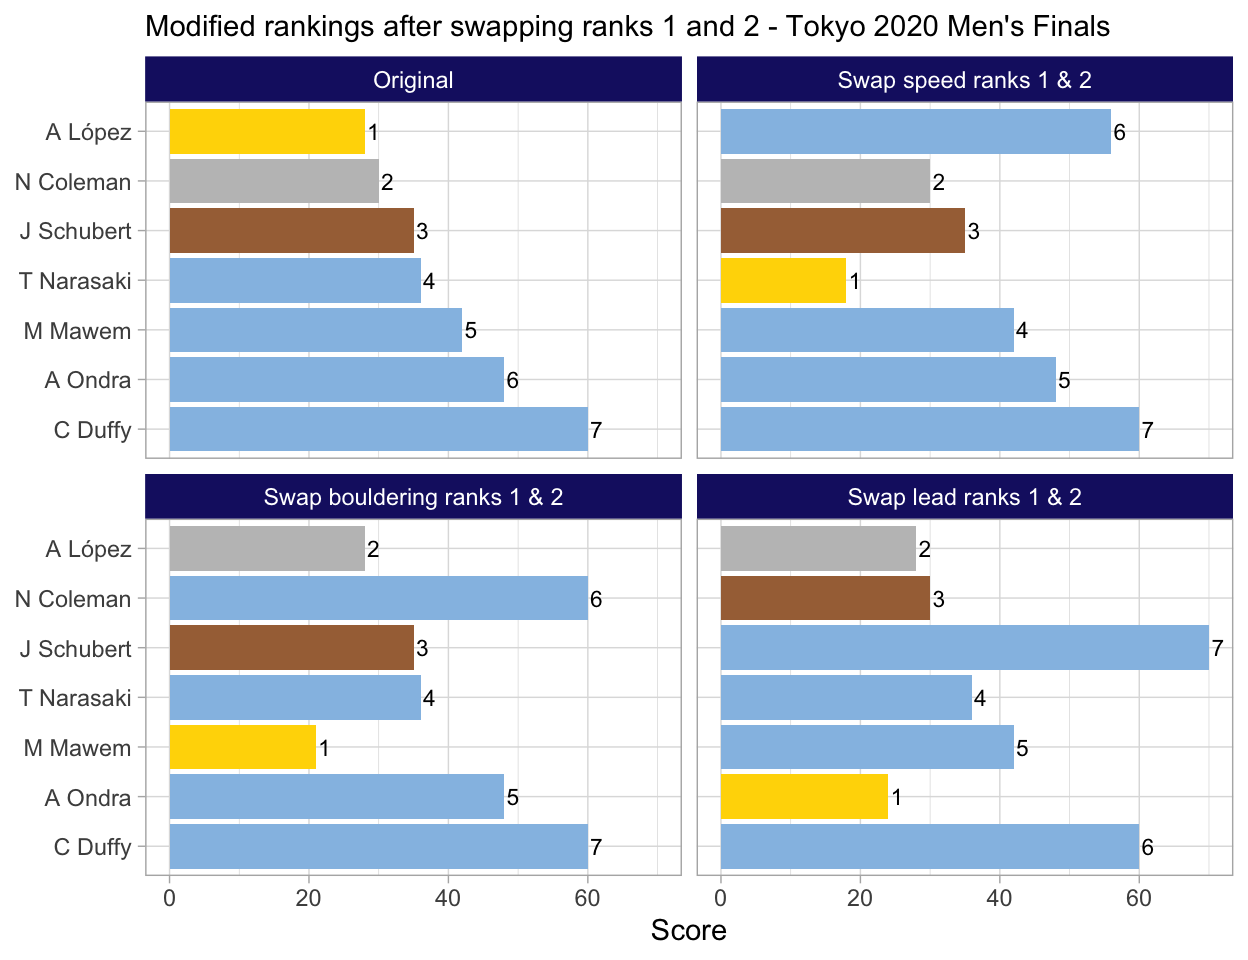
Sport Climbing at Tokyo 2020, Part III: Rank Swapping
A competition of small margins.
Sport Climbing at Tokyo 2020, Part II: Competition Format
Who's Suffering? Who's Relevant?
Sport Climbing at Tokyo 2020, Part I: A Simulation Study
Simulation time!
Sports Animation Gallery - June 2021
Leveling up with {gganimate}.
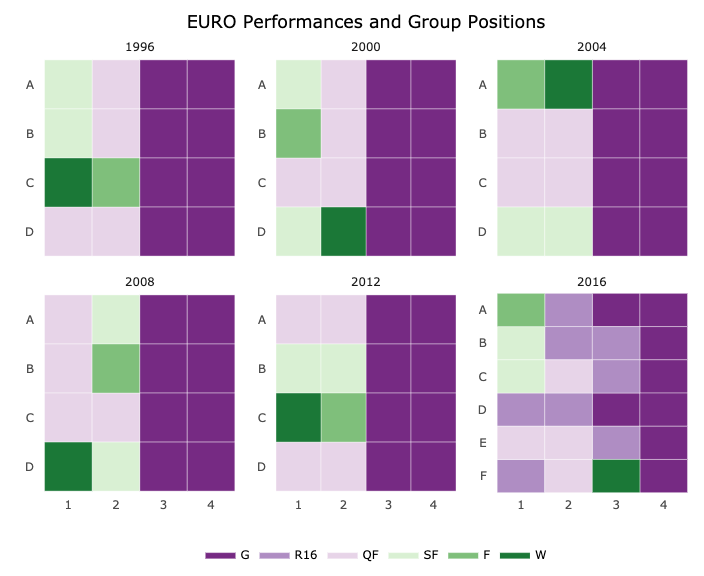
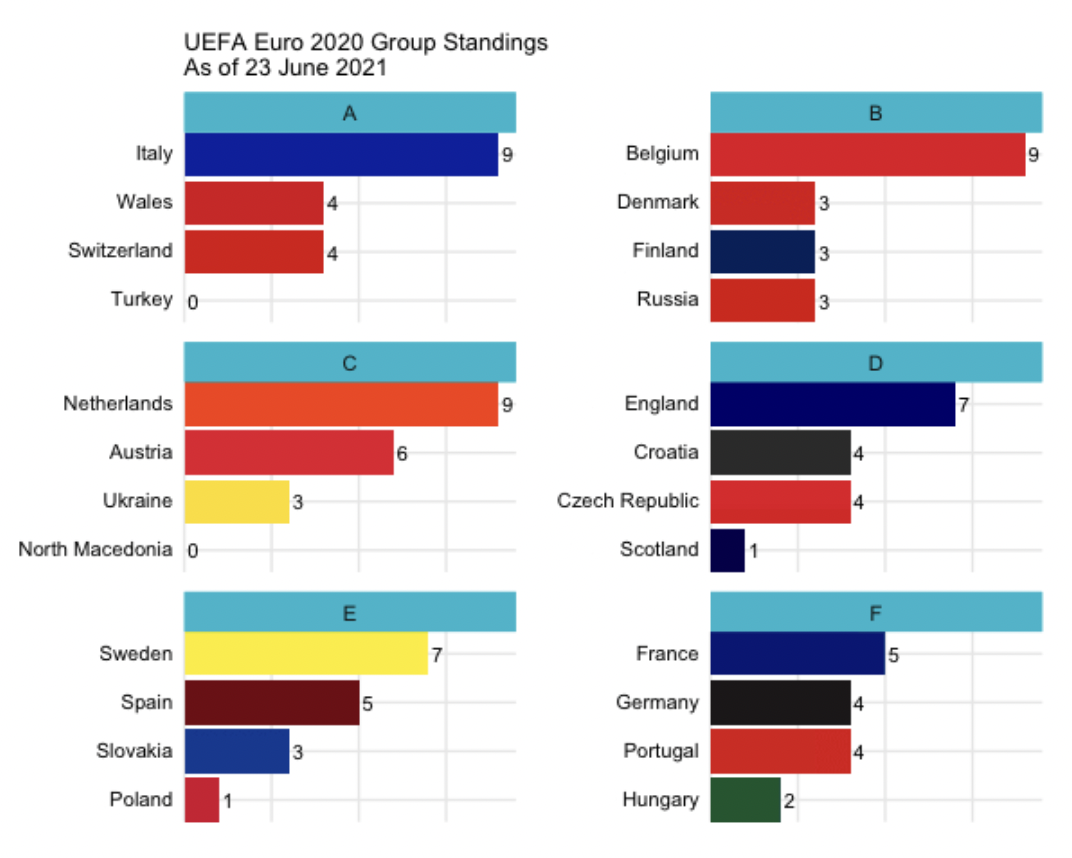
EURO Group Tables and Knockout Performances
Everybody loves cinderella stories and fairy-tale runs.

Rules
Just a few simple rules on this blog.