I recently saw this Twitter post about a heatmap of the first 100000 digits of \(\pi\):
A visual representation of the first 100,000 digits of π pic.twitter.com/MPGpckbds0
— Fermat's Library (@fermatslibrary) July 31, 2022
Let’s see how closely I can recreate this figure.
First, let’s get data for the first 100000 digits of \(\pi\), clean it up, and transform it to the right format. I will let the figure size be 400 x 250.
library(tidyverse)
library(rvest)

pi <- read_html("https://www.angio.net/pi/digits/100000.txt") |>
  html_text() |>
  str_remove("\\.")

pi_digit <- tibble(digit = pi) |>
  mutate(digit = str_split(digit, "")) |>
  unnest_longer(digit) |>
  mutate(row_index = rep(1:400, 250),
         col_index = rep(1:250, each = 400))
Now, a few lines of ggplot2 should give the desired
visualization.
pi_digit |>
  ggplot(aes(row_index, col_index, fill = factor(digit))) +
  geom_tile() +
  scale_fill_manual(values = rainbow(10)) +
  scale_y_reverse() +
  guides(fill = guide_legend(nrow = 1, title = NULL)) +
  coord_equal() +
  theme_void() +
  theme(legend.position = "bottom",
        legend.direction = "horizontal",
        legend.text = element_text(size = 9, margin = margin(l = -17, unit = "pt")))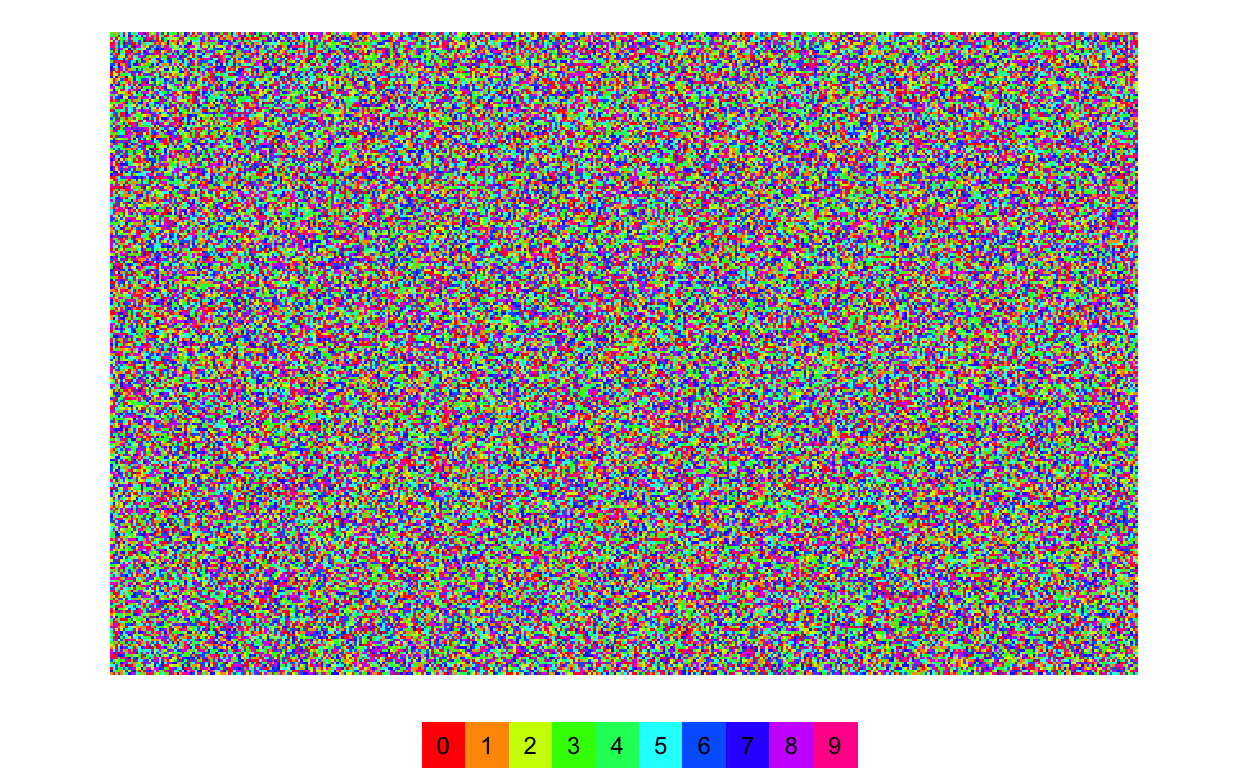
Breakdown:
geom_tile()did the trick here. This one of my favoriteggplot2functions.I recognized the color scheme in the original plot is quite similar to a rainbow palette. The function
rainbow()came in handy here.I also reversed the y-axis scale, to ensure the first digit (3) is on the top left.
With a bit of digging, I was able to figure out how to move the legend text inside the colored keys.
Bonus: let’s play the same game and plot the first 100000 digits of \(e\) (Euler’s number).
e <- read_html("http://boston.conman.org/2004/11/12/e100k.txt") |>
  html_text() |>
  str_remove("^[^\n]*\n") |>  # remove first line
  str_remove_all("\\s")       # remove all whitespace

# append 2 to the string of first 99999 digits
# since these are digits after the decimal
e_digit <- tibble(digit = str_c(2, str_sub(e, 1, 99999))) |>
  mutate(digit = str_split(digit, "")) |>
  unnest_longer(digit) |>
  mutate(row_index = rep(1:400, each = 250),
         col_index = rep(1:250, 400))

e_digit |>
  ggplot(aes(row_index, col_index, fill = factor(digit))) +
  geom_tile() +
  scale_fill_manual(values = rainbow(10)) +
  scale_y_reverse() +
  guides(fill = guide_legend(nrow = 1, title = NULL))+
  coord_equal() +
  theme_void() +
  theme(legend.position = "bottom",
        legend.direction = "horizontal",
        legend.text = element_text(size = 9, margin = margin(l = -17, unit = "pt")))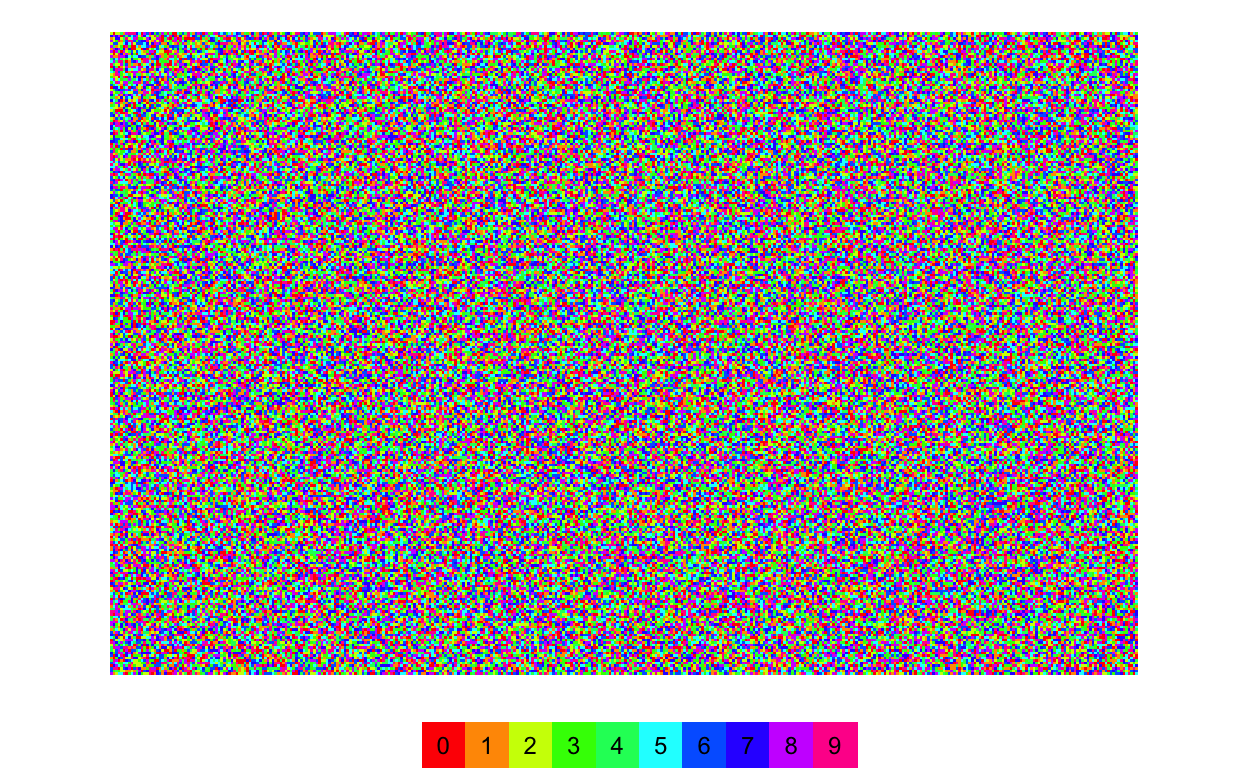
Both figures look noisy. There’s no pattern at all for these two famous numbers.